Creating daily analyses of surface air temperature globally
Climate models are always run for a historical period and (often) also for the future to get an idea of the climate change that we can expect. The quality of the projections for the future can only be determined indirectly, since we, of course, have no observations for the future. For the past we do have observations, therefore the climate model runs for the past are compared with the historical observations. The Global daily air temperature based on station and satellite data, 1850 on can also be used user for the historical temperature observations.
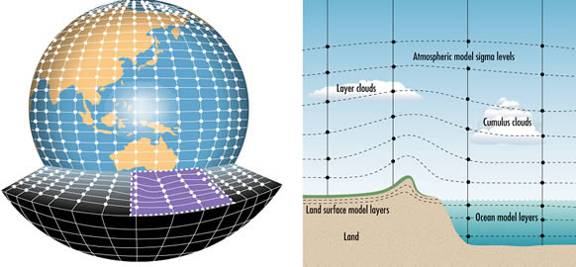
Figure 1 Schematic presentation of a climate model: the earth is subdivided in many grids in horizontal and vertical direction: the climate model simulates the climate for each grid.
Climate models calculate the average of the climate variables over a grid (Figure 1). Grid size varies between climate models (Figure 2). In global climate models the spatial resolution is relatively coarse, although now also high resolution global simulations are under development with grid sizes of about 25 km (e.g. in the PRIMAVERA project). Observational station data cannot be compared directly with the climate model data, since the station data give point measurements and the climate model give area average data. This is especially a problem for precipitation data (since some rainfall is very local), but also for temperature in a spatially heterogeneous area this may cause difficulties.
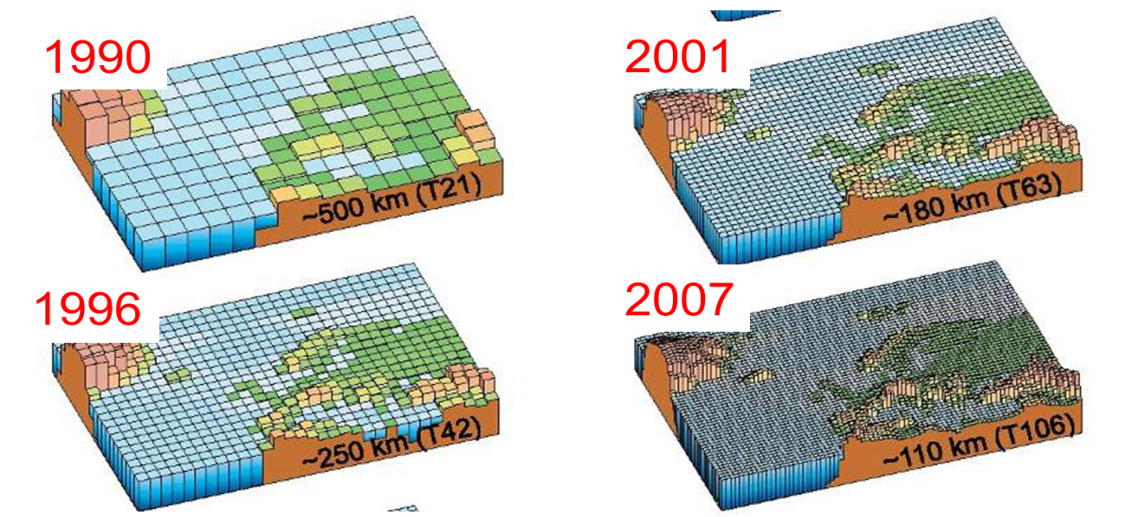
Figure 2 Evolution of spatial resolution in Global Climate Models used for IPCC assessment reports (Source: www.wmo.int/pages/themes/climate/climate_models.php).
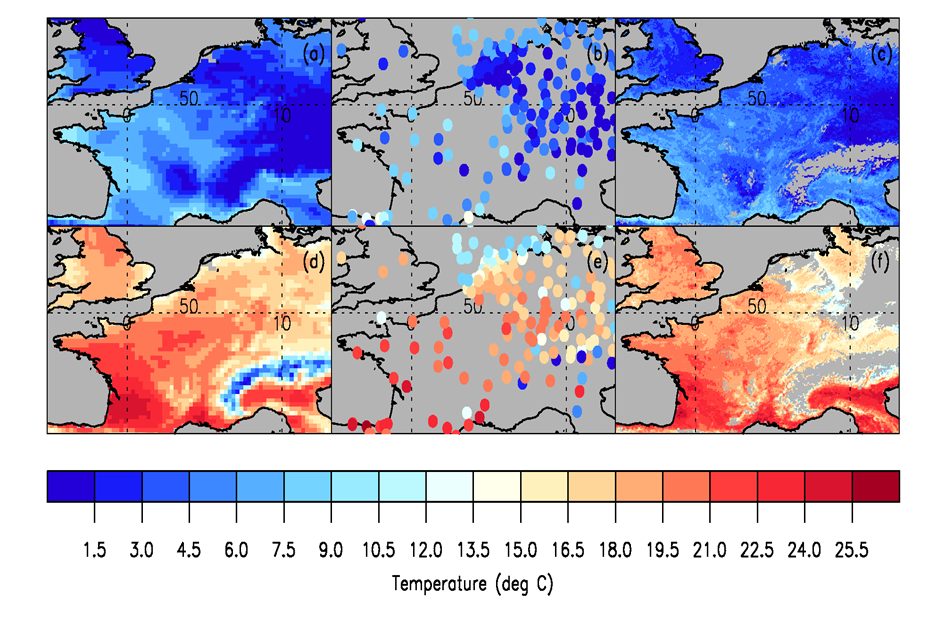
Figure 3 Differences in spatial resolution based on different data sources (E-OBS: based on interpolation of station data from ECA&D taking into account height) (Source: E. Good)
Station data are only available for a limited number of locations, whereas climate models simulate the climate for a large region or the whole globe. To overcome this, the following approaches can be followed:
In climate models every grid is assigned a certain “surface”: land, sea, ice, etc. To assign a grid to a certain surface a “mask” is used (Figure 4). Although the grid size has decreased considerably in the past, it is still not exactly the same as in reality. In reality grids may contain two or more types of surfaces (e.g. land and ocean). The satellite observations used in EUSTACE are based on reality and in the project different methods are used to estimate the air temperature from the skin temperature above different surfaces. For a grid that contains in reality more than 1 type of surface, estimates of the air temperature for the various surfaces within that grid are made within EUSTACE. This is possible since the spatial resolution of the used satellite data is clearly higher than the final spatial resolution in the EUSTACE-data set (about 0.25˚).
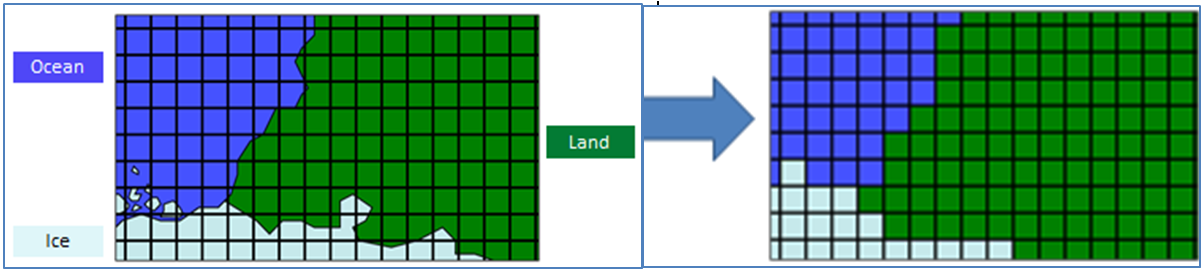
Figure 4 Left: hypothetical distribution of the “surfaces” ocean, land and ice over different grids. Right: a way to create a “mask” where only one surface is assigned to a grid cell (in this case land (green) is used in preference to ice (light blue) and ocean (blue), and ice is used in preference to ocean).
PRIMAVERA is working on high resolution global climate modelling. Several models will be run on a 0.25° spatial resolution and will be compared with model simulation with coarser resolutions, used until now. The idea behind this is that several processes may be simulated better due to the higher resolution. As part of the process of climate model development the model results are always validated. The currently available sources of data for the past-current climate do have some disadvantages:
During the development of the data file structure for the EUSTACE products, someone form the PRIMAVERA project was interviewed. The final EUSTACE dataset is interesting to them since it will be a global dataset covering all surfaces, and since it has a high resolution (similar to the one they use for their highest resolution runs):
Validation of climate model projections is done by comparing the statistics produced by the climate model with the statistics of the “observations” , e.g. for the average temperature in a month, or for the highest temperature reached per year. In the final EUSTACE-dataset information is given on the uncertainty per day, but also an ensemble is produced to describe the uncertainty. If one wants to take into account the uncertainty in the EUSTACE-dataset for validation of climate model projections, the ensemble can be used best.