Creating daily analyses of surface air temperature globally
Detection of climate change is demonstrating whether a climate has changed significantly, or in other words showing that the change is more than can be explained with natural variability alone. Attribution of climate change is the effort to scientifically determine what can be the cause of observed climate change. In most cases this focusses on determining whether the change can be due to the increase in Greenhous gas (GHG) and not by natural variability alone. IPCC assessment reports have paid attention to attribution of global and regional temperature increases.
When extreme weather events occur, often the question arises whether the event is due to climate change. A single event cannot be attributed to climate change, but we might be able to indicate whether the return time of certain extreme events has changed significantly due to climate change or whether there is a significant trend in the likelihood of extreme events. One of the first studies on this so-called event attribution showed that the risk for a European heat wave such as in 2003 had clearly increased due to climate change (Stott et al., 2004). Methodologies for attribution of extreme events have been developed in several projects, among others in EUropean CLimate and weather Events: Interpretation and Attribution (EUCLEIA) and the World Weather attribution (WWA) project (follow up of EUCLEIA). The projects try to provide information on attribution relatively fast after the extreme weather events have occurred, when there is a need and still interest from decision makers and the public. In both projects several types of extreme weather events are considered, including extreme heat and cold. Below we will indicate how the EUSTACE-dataset can contribute potentially to the attribution of extreme warm and cold weather events.
In between the description of the methods used for event attribution we describe in italics the potential use of the EUSTACE-dataset and the aspects that people have to take into account when using it.
To determine whether the probability of extremes has increased long time series are needed and different types of climate data are combined (e.g. observations and climate models).
The first step in the attribution studies is to select appropriate climate indices. This can be a few-days-extreme (three-day maximum temperature average as used for the analysis of the European heat waves in 2017 and 2018; figure 1) or multiple-weeks-extreme (as used in the analysis of record June temperatures in western Europe in 2017, or the two-week cold outbreak in northern North America). In some of these analyses, station data are used (for one location) and in others the average temperatures over regions are used.
If EUSTACE data are to be used for such analysis, this requires good representation of the extremes (maximum, minimum and average temperatures) at daily, weekly and monthly scales and good spatial representation (e.g. spatial extend of heat waves or cold spells). In the main EUSTACE-dataset the best estimate is presented and also the “climatology fraction” is given. When little local information is available e.g. from nearby stations for a particular period, the climatology fraction will be high and the estimate of the daily temperature will be “smoothed” to the longer term average. The EUSTACE-ensemble that is also produced will contain a better estimate of the extreme high or low temperatures (In some areas the total uncertainty is under- or overestimated. In case of underestimation of the uncertainty the range of potential values in the ensemble will also be underestimated. Information about this is available in the user guide under validation).
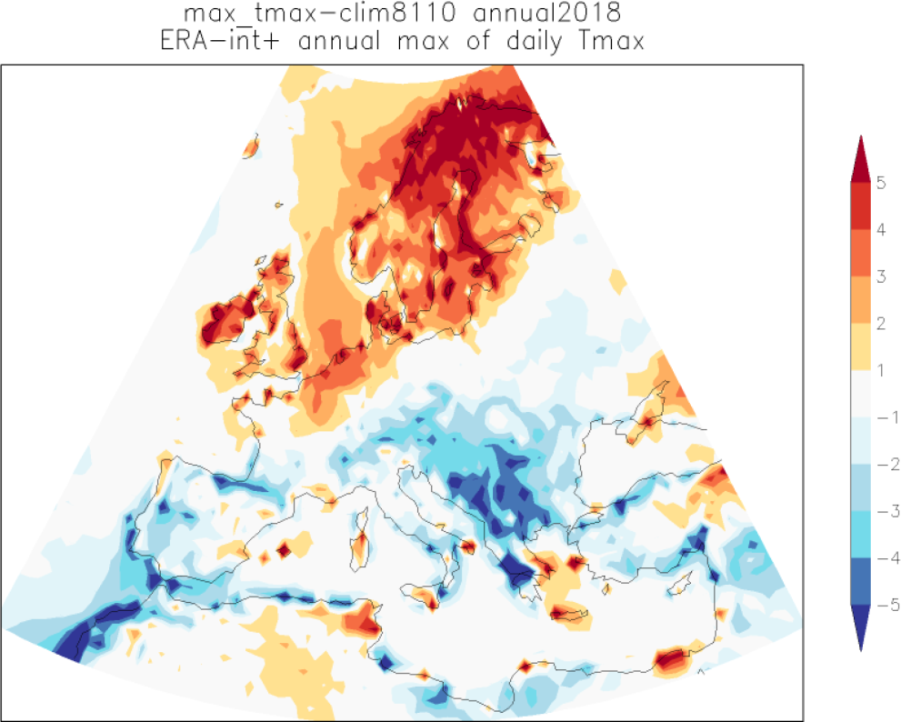
Figure 1 The hottest 3-day average of the maximum temperature in 2018 (ECMWF analyses up to 24 July, forecasts up to 31 July) compared to the highest 3-day maximum temperature in the period 1981-2010 that is currently the “normal” period (based on ERA-interim re-analysis). Along coasts there are artefacts from comparing the high-resolution ECMWF analyses with the lower-resolution ERA-interim reanalysis (Source: https://www.worldweatherattribution.org/attribution-of-the-2018-heat-in-northern-europe/).
The second step involves determining the probability of the extreme event in the recent climate (in the “normal” period: figure 1 above) and its probability in the past when the concentration of greenhouse gases (GHGs) was much lower. Historical observations are regularly not available for a long enough period to enable such an evaluation. n model based approaches simulated weather and climate phenomena are compared under different input conditions: for instance, with and without human-caused changes in GHGs. Also combined approaches exist (NAS, 2016).
For determining the probabilities, observational data are used and a Generalized Extreme Value Distribution (GEV) or other statistical distributions are fitted and confidence intervals are determined (figure 2 below). After this it is determined whether there are significant changes or trends in the occurrence of these extreme events (detection whether the climate has changed).
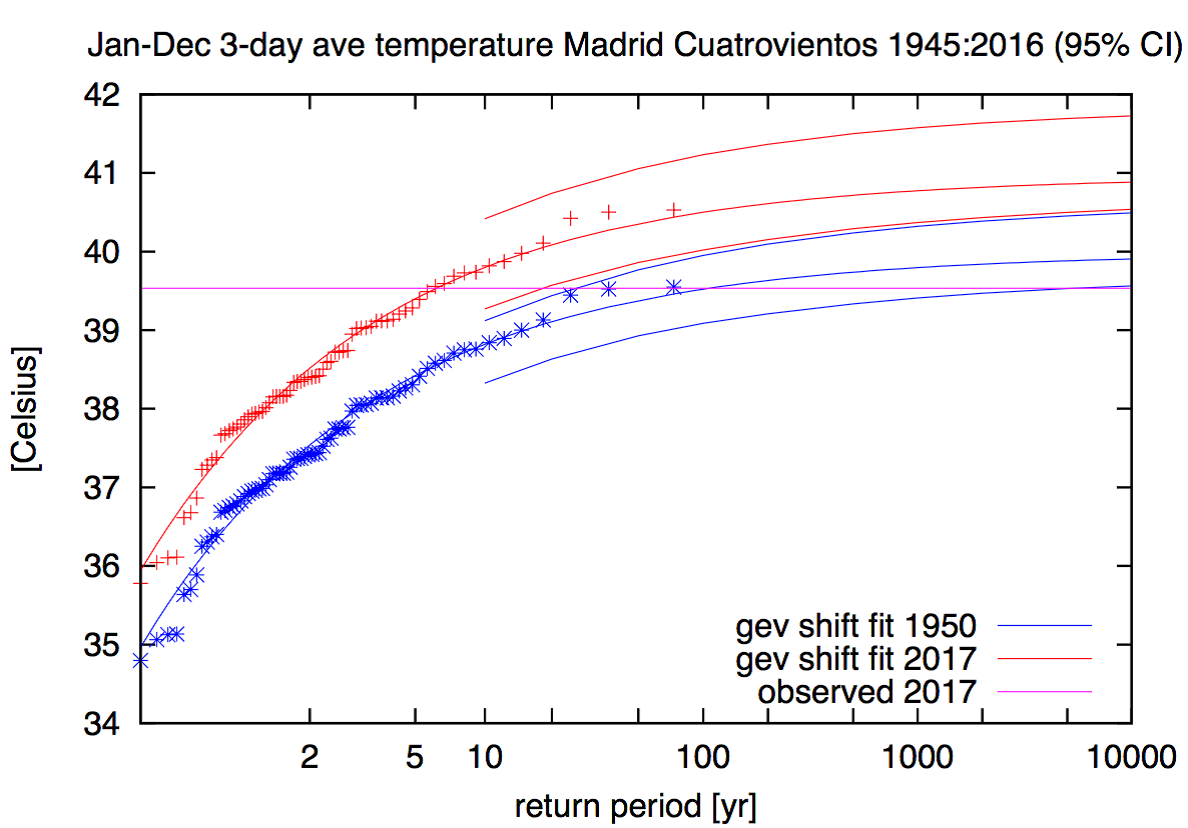
Figure 2 Example of the determination of the 3 day mean maximum temperature for station Madrid Cuatrovientos in the current climate (2017) and around 1950, for an event attribution study on the heat wave in southern Europe in 2017.
The EUSTACE-dataset is a reconstruction of the weather in the past using observations, satellite data and the spatial differences between locations. The dataset represents an alternative to station data or re-analysis data for determining how extreme a certain event is in the current climate (often 1981-2010 is used). The EUSTACE-dataset provides a clearly higher spatial resolution than the station data in most regions in the world. The newest re-analyses have a similar spatial resolution as the EUSTACE-dataset, but they cannot always represent extremes very well. Especially in the period with satellite data, the EUSTACE-dataset may have added value since spatial differences and extremes may be represented better.
The EUSTACE-dataset provides much longer time series and for many more locations in the world than with station data alone. As such the dataset makes it easier to determine how extreme a certain event is in the current climate and whether the probability has changed compared to periods with clearly lower GHG concentrations. However, in regions with relatively few observations in the past, the estimates of the daily temperatures will contain larger uncertainties and extremes are represented potentially less well. When determining the confidence intervals for the probabilities one has to take into account the uncertainties due to natural variability, but also the uncertainties in the estimates of the temperatures (with the help of the ensemble or the other uncertainty information). In such regions the combined uncertainty will be much larger and it will be more difficult to find significant differences in probabilities, especially for extremes such as the above mentioned 3-day average maximum temperature. This is also true for periods in the 19th century and in the early 20th century with relatively few station data.
During the generation of the EUSTACE data set inhomogeneities (or break points) in the underlying observational data sets are corrected for. Therefore, it is less probable that changes in probabilities in the EUSTACE datasets are caused by changes in station locations, changes in instruments, etc. (figure 3 below for example of inhomogeneity).
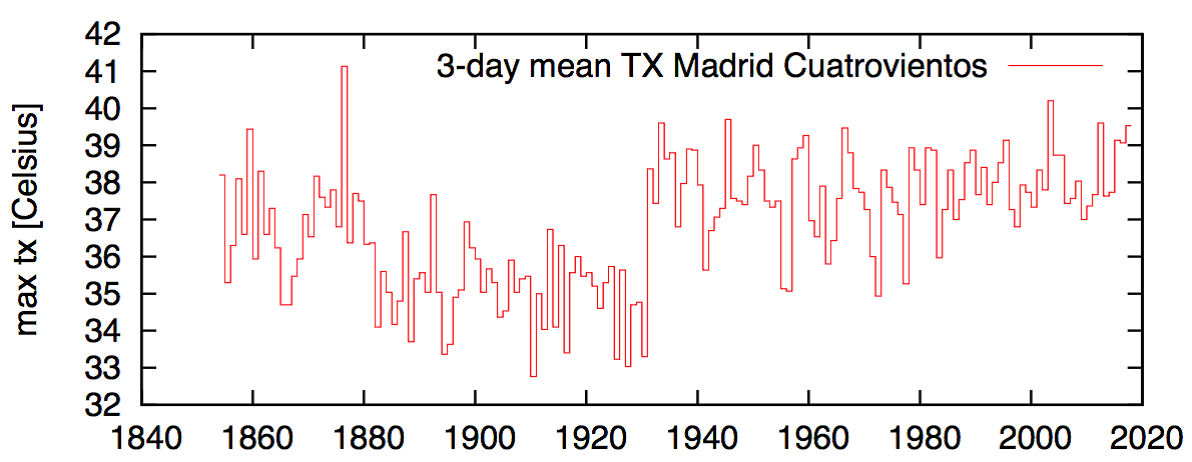
Figure 3. Inhomogeneity in the 3-day mean maximum temperature for station Madrid Cuatrovientos in the early 1930’s. with these inhomogeneities it is not possible to determine changes in probabilities.
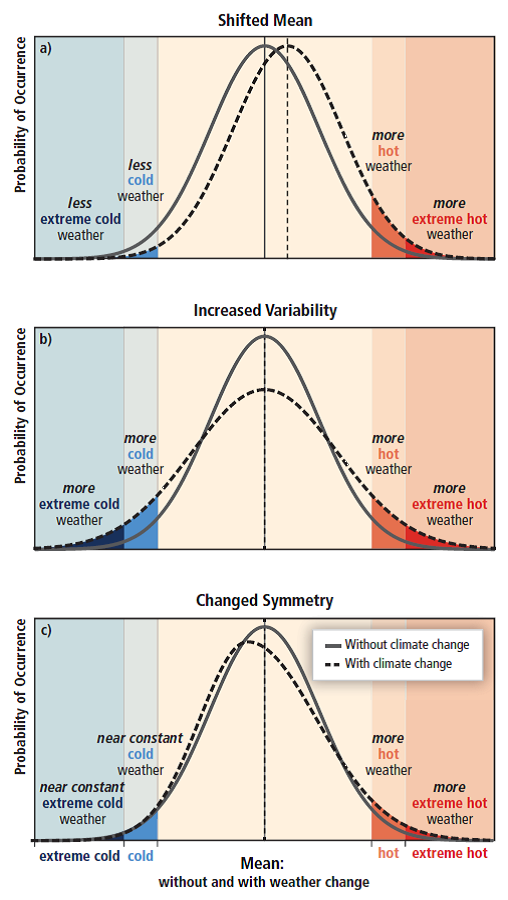
Figure 4. Probability density functions showing different ways in which the climate can change, all resulting in changing probabilities of extremes (Source IPCC, 2012).
In the third step it is determined whether the change can be due to the increase of GHGs. When climate change is detected in step 2, it is not clear yet whether there is a relation with the increase of GHGs. For the attribution, a link is sought with a factor that is clearly influenced by the increase of GHGs. The most obvious climate variable is temperature. For this in the statistical approach, global warming is factored in by allowing the fit to the distribution to be a function of the global mean surface temperature (GMST). Thus the probability density function is shifted up or down with GMST but does not change shape (although this is not always a valid assumption; figure 4 above). In this way, it results in a distribution that varies continuously with GMST. This distribution can be evaluated for a GMST in the past (e.g., 1950 or 1900) and for the current GMST. If there is a clear relation between the climate index under study and the GMST (and thus with the increase of GHGs) the probability of the climate index under study will have changed over time.
In the methods used by EUCLEIA and WWA the observations are also compared with climate models that are available and suitable for the climate variables and regions under study. This allows to study better what is the cause of the observed change in climate. This requires that in the used models the variability of the studied extremes is compatible with the observed variability.
The EUSTACE dataset can be used to determine the Global mean surface air temperature and its change or the mean surface air temperature for a region.
The EUSTACE-dataset can also be potentially used for determining whether the variability of the studied temperature extremes in the climate models is compatible with those in observations. This can only be done for periods and regions where we know that the day-to-day variability (and thus the extremes) is represented well (low climatology fraction in final EUSTACE dataset). This is probably the case for the period with satellite data and periods and regions with sufficient station data. Important for this comparison is also that the dataset is homogeneous. During the generation of the EUSTACE data set inhomogeneities (or break points) in the underlying observational data sets are corrected for. Changes in probabilities in the EUSTACE datasets will, therefore, probably not be caused by changes in station locations, changes in instruments, etc.
References
IPCC, 2012. Attribution of Extreme Weather Events in the Context of Climate Change. (Field, C.B., V. Barros, T.F. Stocker, D. Qin, D.J. Dokken, K.L. Ebi, M.D. Mastrandrea, K.J. Mach, G.-K. Plattner, S.K. Allen, M. Tignor, and P.M. Midgley (Eds.)). https://doi.org/10.17226/21852.
NAS, 2016. Attribution of Extreme Weather Events in the Context of Climate Change. Washington, DC: The National Academies Press. https://doi.org/10.17226/21852.
Stott, P.A., D.A. Stone & M.R. Allen, 2004. Human Contribution to the European Heatwave of 003. Nature 432(7017):610-4. DOI: · 10.1038/nature03089
Otto, F. E. L., G. J. van Oldenborgh, J. Eden, P.A. Stott, D. J. Karoly, M.R. Allen. “The Attribution question”. Nature Climate Change 6 (2016): 813 – 816. doi:10.1038/nclimate3089. https://www.nature.com/articles/nclimate3089#affil-auth