In climate research, scientists are confronted with a problem apparently trivial, but in reality incredibly complex: How to get historical weather observations to study climate? The world is covered by thousands of weather stations - it has been for more than a century - yet the collection and distribution of their measurements is not officially coordinated at international level. Scientists regularly need to ask single station managers (e.g., national meteorological institutes) for data. The answer is not always positive, the data may be subjected to use restrictions that can hamper their scientific value, or have a monetary cost. Even in the best scenario, collecting them this way can turn out to be an extremely time-consuming effort.
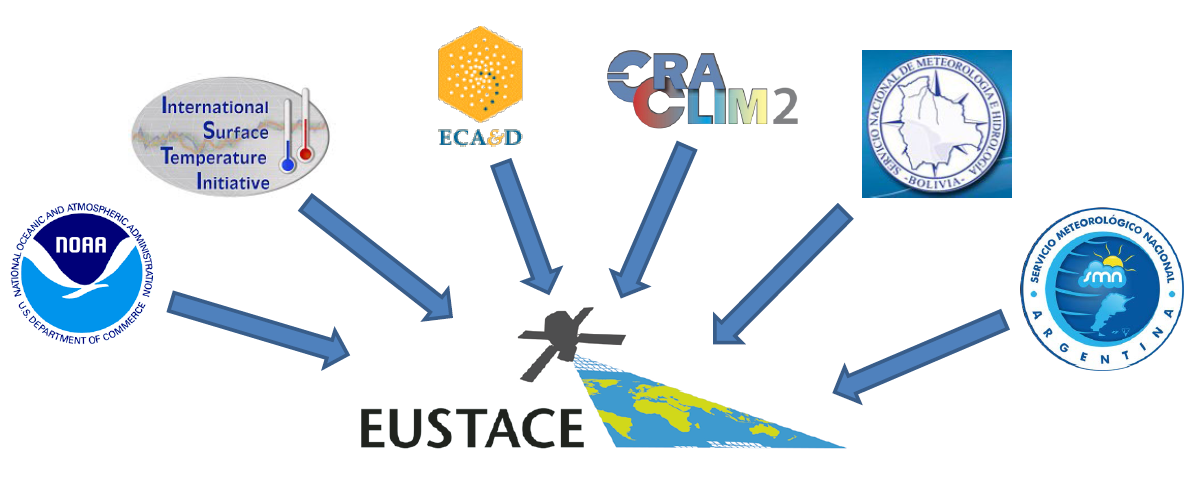
A few initiatives, most notably the ones led by NOAA in the United States (http://www.ncdc.noaa.gov/ghcn-daily-description) and EUMETNET, the organization of European National Meteorological Services, (http://www.ecad.eu), have tried to tackle the problem by creating and maintaining continental or even global data collections for several variables (in particular daily temperature and precipitation). These data collections are of utmost importance for climate research and constitute nowadays the basis for most publications that study in-situ observations, as well as the bulk of the in-situ observations that are being used within the EUSTACE project (Fig. 1).

Still the lack of an official international repository leaves significant drawbacks on these collections. Station managers are not the only ones who are asked to contribute, but also data users such as climate researchers can submit data that they collected for their work (in many cases the station managers cannot answer anymore, think of data measured in the 19th century...). This has the advantage of maximizing the quantity of data included in the collection, at the price of increasing redundancy and confusion.
Before being submitted, a data series might have come through different processing phases (quality control, unit conversion, roundings, homogenization, etc.) by different persons. Regularly, no record remains of these passages, therefore one is never sure of what was actually measured by the weather station (let alone the how) and what is the product of successive elaboration. Moreover, because humans make mistakes, hence the more the elaborations, the more the probability of errors being introduced.
If you are interested in studying daily temperature at a certain location, you will often find several versions of the same temperature record, usually covering different but overlapping time periods. Some data series can be a “collage” from different stations, but you will only get one set of coordinates for the station's position. Sometime two data series contain exactly the same observations, but they are assigned to two different stations many kilometers apart. Sometimes two completely different data series are assigned to the same station. One can of course write to the data providers to find out more, but then we are back to square one!
When dealing with global data sets, it is important to be aware of these issues and to do what is possible to reduce their influence on the final results. This is done in EUSTACE by automatically comparing each data series with the others (taking into account roundings, conversions and temporal shifts), in order to remove duplicates. Coordinates are verified through comparison with a digital elevation model. Data quality of each observation is assessed through 14 different quality tests. Four homogeneity tests are applied to each temperature record to detect non-climatic signals, such as those introduced by merging data from different stations.
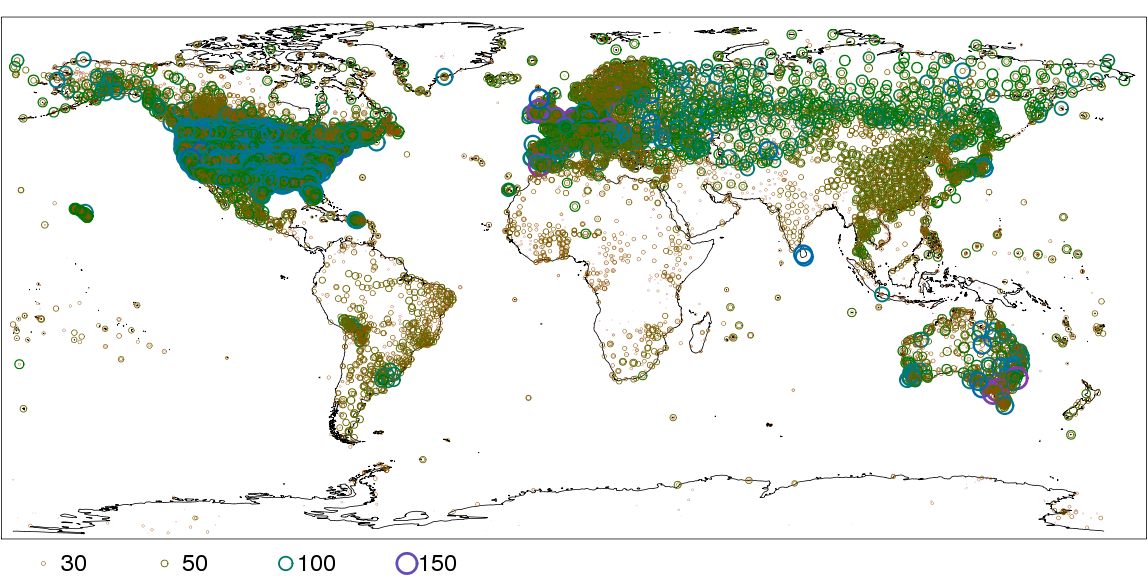
Much can still be done by the scientific community (and by policymakers) to improve accessibility to climate data. This is particularly crucial for those countries where climate change is likely to have the largest impacts, since these are often the same countries where little or no climate data are available to scientists (Fig. 2).


Comments
There are currently no comments