“I have no data yet. It is a capital mistake to theorize before one has data. Insensibly one begins to twist facts to suit theories, instead of theories to suit facts.” This quote from Sherlock Holmes to Dr. Watson captures the central idea of EUSTACE. A clear view on the historic perspective of climate change and climate variability, including the climatic extremes, is essential for understanding how and why the temperature of the earth changes. So far, so good – but the point of this blog is not to confirm the view on the necessity to collect and understand observational data. In this blog, we would like to take you to the situation where data is not yet collected. How to get to the situation where one has data? And can we trust this data? Uncovering and understanding observational data – especially when it is not data from the most recent period – requires skills which would suit a detective!

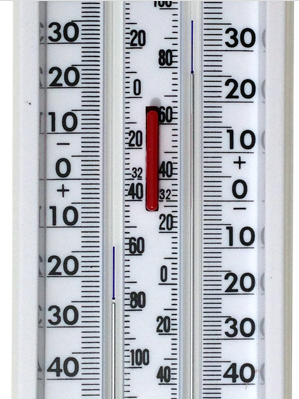
One example is data recently uncovered from Bolivia (see graph for station Anzaldo). In the plot of the data, the strange gap from the late 1970s to the early 1980s is clear. This can’t be right, but what happened here and can we adjust for this problem? It turns out that the observer of this thermometer probably did not quite know how to read the minimum and maximum recording thermometer (see picture) which results in a gap in the temperature distribution. This may seem foolish, but in many developing countries, the measurement network depends very much on manual observations and without proper instructions, the quality of the data suffers. For the Climate Services-minded among the readers; this example shows that there is so much to gain with providing basic training to the staff of meteorological services of developing countries. There is no better way for a country to become ‘climate proof’ then to get the observations in order, making clear what challenges the country has to face.
 One of the longest measurement series in Southeast Asia is found for Jakarta, Indonesia. Subdaily measurements of temperature and precipitation start in 1866. Until 1875 Sundays are missing – Sunday is a day of rest, also for meteorologists. On the morning of 18 November 1945 measurements at Batavia – as Jakarta was called under Dutch rule – are ceased because of the Japanese invasion. Measurements are resumed on 1 May 1948 where time is measured in UTC rather than local time as was the case prior to this date. The final challenge to interpret the data is the growth of the city which totally transformed the surroundings of the measurement site. Initially, measurements were taken outside the city on the banks of the river Ciliwung but since the 1960s, the city has grown enormously. Despite these issues, this series contributes to the temperature-change picture EUSTACE paints.
In Europe, one has such historic treasures as well. At the University of Bern, data from Tirol has been discovered – the part of Tirol that has been part of Austria before the first World War and which has been Italian since. The data found originate from the period before WWI, available in Austrian archives but (due to the geopolitical changes) ‘orphaned’. Within EUSTACE, these data are uncovered and digitised by the University of Bern and made available for EUSTACE.
Finally, there are some problems with observational data which can fool the user who is not intimately aware of some of the problems with these data. Throughout Europe, meteorological stations have been relocated in the 1950s from the relatively warm city environment to much cooler nearby airfields. Interesting is that this move actually resulted in a cooling signal! (and something you do not hear the climate skeptics about) Clearly, this spurious non-climatic trend needs to be removed. One of the tasks of EUSTACE is to adjust for these (and other) changes which handicap a correct interpretation of the data. After all, before one knows it, twisted facts are used to suit theories!

Comments
There are currently no comments